New Kansas Statistical Abstract offers relevant state information, including expanded data on climate
LAWRENCE — The 57th edition of the Kansas Statistical Abstract, an annually released compendium of data about Kansas, is now available on the Institute for Policy & Social Research website.
The KSA publishes data in 17 sections ranging from agriculture to vital statistics and health. These data help community leaders, entrepreneurs, researchers and others make informed decisions and understand how Kansas is changing.
“The KSA paints a statistical portrait of the state of Kansas — what we looked like in the past and what we look like now. Kansans use the KSA to learn more about their communities, whether it be about agricultural production or educational attainment,” said Donna Ginther, Roy A. Roberts and Regents Distinguished Professor of Economics and director of the Institute for Policy & Social Research.
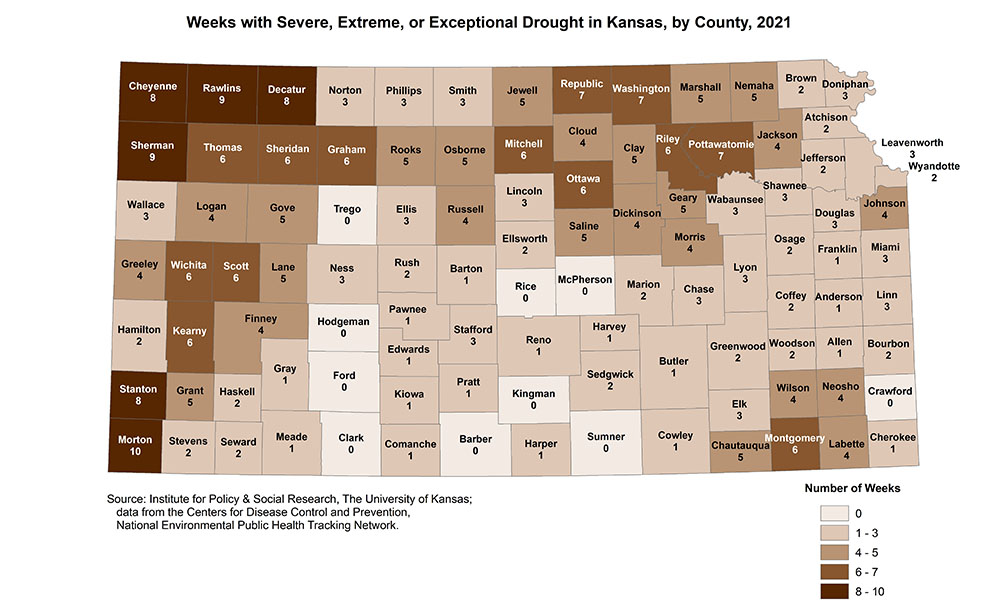
As the United States experiences a series of extreme weather events, including widespread heat waves and wildfires, the 57th edition of the KSA includes a newly expanded chapter on climate. One map shows the number of weeks in 2021 with severe, extreme or exceptional drought in Kansas by county. In 2021, 95 of the 105 counties in Kansas experienced at least one week with such drought, and five counties experienced 8-10 weeks of such drought. Drought can have significant impacts on the health of residents as well as the economic productivity of a place.
The KSA also includes a map comparing the total precipitation in 2022 to the 30-year average annual precipitation for each of six Kansas regions. Throughout the state, annual precipitation for each region fell between 5-10 inches. In the western part of the state, this decline was especially steep. One region received just over half the rainfall in 2022 compared to the average rainfall in this region from 1981 to 2010.
The climate chapter in the newest edition of the KSA also features a map showing the number of days in 2021 with a maximum daily temperature of 100 degrees or higher by county in Kansas. Of the 105 counties in Kansas, 33 experienced more than 21 days of extreme heat, and all but 14 counties experienced at least one day of extreme heat. Extreme heat hit central Kansas especially hard in 2021.
“With an increasing number of climate events, we felt it was important to add data and maps quantifying extreme heat and drought to help Kansans understand local trends and potential impacts on our health and economy,” said Xan Wedel, senior research data engineer for IPSR and a key member of the KSA team.
Prepared by staff and students at IPSR, the KSA is available on the IPSR website at no cost to users. Resources include a PDF of the current edition and all previous 56 editions, and electronic files for each resource in spreadsheets or high-quality images.
Image: Weeks with severe, extreme or exceptional drought in Kansas, by county, 2021. Alt text: Chloropleth map showing severity of drought in Kansas by county, with most severe drought in northwestern and southwestern counties and some drought throughout most of the state.